On to SNA Class
Source: hanspoldoja
Ever since I read Albert-László Barabási’s book Linked, I found the subject of networks and their study fascinating. Linked was published back in 2003 and introduced its readers to different kinds of networks as well as notions defining their structure. The author, a physics professor at Notre-Dame, takes you through various themes including random networks, six degrees of separation, small-world networks, synchronization of fireflies, power laws in networks or preferential attachment – a Barabási special. The bibliography of Barabási’s book points to further material which I explored at my own pace over the years, including manuals targeting social studies such as Wasserman and Faust. Another leading figure in social network analysis (SNA) applied in particular to organizations is Valdis Krebs. He consults regularly on networks and blogs at TheNetworkThinkers. Valdis remains a source of inspiration for applying SNA to better understand what goes on in complex systems, from organizations to Twitter.
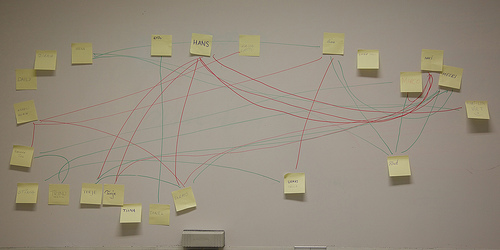
Tinkering With #DG2G
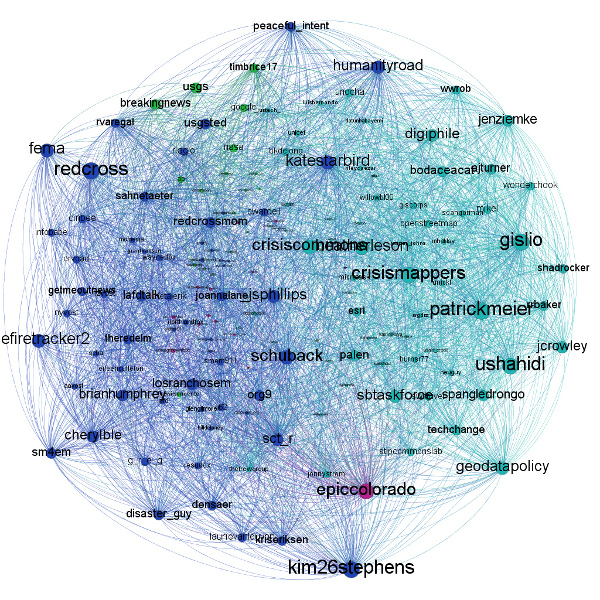
In order to study networks, one needs data. Students can still turn to the data sets found in SNA textbooks but nowadays social media platforms such as Twitter provide a great way to gather interesting data without much effort. Representing network graphs, which is also a complex task, has benefited from advances in software, in particular IDEs. Gephi is a an open source visualization and manipulation software developed on top of NetBeans, an IDE popular among Java developers. I followed last week a fascinating conference organized by the Wilson Center on Connecting Grassroots to Government through Open Innovation. This conference which lasted two days, used Twitter to further amplify the discussion and collect additional input. I used my personal Twitter collection tool to download 1,630 tweets containing the hashtag #DG2G and analyze the handles mentioned in the Tweets. I wanted to get a picture of who was being mentioned and how they related.
I proceeded as follows:
- Use Python tool twecoll to generate unique list of handles mentioned (skip participants with more than 3000 friends)
- Retrieve friends for each handle and retain only connections between those mentioned
- Generate GML file for nodes (handles) and edges (connections)
- Use Gephi to load GML file
- Calculate a community structure among the remaining 158 handles using Modularity
- Color nodes based on the 7 communities identified – two colors dominate though: disaster relief and crowdmapping
- Layout graph using Gephi
- Display node names and set font proportional to authority value calculated by the HITS algorithm – the more influential handles appear with larger fonts, e.g. Patrick Meier is mentioned only twice but appears as an authoritative figure in crowdmapping
The result is shown below.
Since I am a novice and eager to learn the details behind these algorithms and other metrics I could derive from the data, I decided to join Lada Adamic’s SNA Class on Coursera. I found out about Coursera only a few months ago through a machine learning aficionado while working on a big data project. I had previously noticed Adamic’s interesting paper on recipe recommendation using ingredient networks.
Sensing Citizen Networks
Social network analysis is becoming an established tool used to explore a variety of complex systems. I believe this form of analysis can also be used to assess the networks of citizens sensing across wide urban ecosystems. June Holley and Beth Kanter have already drawn the lessons of researchers in this field and apply it at the grassroots level to help individuals and NGOs weave the right networks for a given purpose. I am looking forward to taking my @SNAcourse over at Coursera and work out the details of citizen sensing performance reports…
 This material is licensed under CC BY 4.0