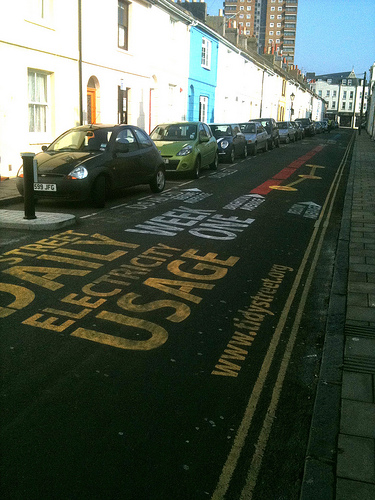
Photo by b0xman
Tidy Street Project
If you are in Brighton UK anytime during the month of April, make sure you pass by Tidy Street. Some households on that street have volunteered to display their electricity consumption at their front window, for everyone to see.
Traditionally, Digital Signage applications are used as advertising networks and aimed at boosting consumption. This application is different. It is the brainchild of CHANGE, a program of the Pervasive Interaction Lab at the Open University. The idea is to take the pulse on energy of five to ten households using small custom sensors and provide the consumption as a visualization to the household, neighbors, passersby and eventually the Internet. At the core of the study are a number of research questions such as identifying the effect of public data display on the household behavior or the impact on non-participating households.
Fight The Power
A friend recently pointed me to a power down contest between two households that took place in the US. A journal of their experience can still could be found online. The experiment shows a few interesting things going on:
- The households are different – one raises chicken and grows tomatoes, the other represents small family
- The household raising chicken ends up returning the sensor; the measures lead to a marginal reduction of the consumption which was initially half of the consumption suggested for an average US household… That household seemed already to know that “the fun stuff in life happens without a remote”
- The small family liked the experience which gave them “control they never had” – a reference to the feedback loop sought in the Tidy Street Project
- The sensing capability and dashboard were used to do a live assessment of the appliances – “walked around turning things off” – To what extent does this require a purchase of sensors? What if the sensors could be rented for a period of time for occasional energy tune-ups.
A previous study by Shultz et al. of the Department of Psychology of the California State University cited by the Tidy Street Project team showed that providing raw data on energy consumption to households may also lead to a boomerang effect. While households above the average tended to reduce their consumption, those below average increased their consumption. Associating a smiley to the values diffused the boomerang effect. Smileys or other form of rating were missing from the US power down. The study be Shultz et al. kept all the household data private whereas Tidy Street is a project of its time applying publicy to its full potential. More details on the Tidy Street can be found in this paper.
Beyond Electricity
Tidy Street is a great initiative and I know that only what gets measured gets actually managed. But there’s more than electrical appliances to our lives. What about heating, mobility, or water?
Magalie Rastello, under the supervision of John Thackara, provided at the Biennale de Design in Saint-Etienne (France) a glimpse of what a public sustainability dashboard might look like.
In order to scale Tidy Street one would have to decouple the elements of the solution and empower households to implement and acquire data on multiple fronts. OpenEnergyMonitor or Flukso come to my mind. The information would then be fed to independent brokers such as Pachube or Open Sen.se allowing yet another actor (public or private) to use the data in order to achieve the ultimate objective of changing behavior.
 This material is licensed under CC BY 4.0
