Learning From Experience
Source: Juliana Rotich
Hugh Knowles recently pointed me to an interesting post by Venessa Miemis considering the use of ICTs (Information and Communication Technologies) to involve citizens in sharing information about services that make their city more resilient. The post makes reference to an initiative called Bay Localize which frames the question of sustainability in its space and time around resilience. Bay Localize, like the Transition Movement, facilitates the transformation of a community from one overly dependent on Business As Usual to one that is able to function despite change and shocks from the outside. These initiatives are initiated by communities in bottom-up style. We have come a long way, in terms of co-creation, since the Earth Summit in 92 which introduced the top-down Local Agenda 21.
There are two specific types of participatory ICTs that we can learn from for sustainable development projects: crisis mapping and citizen science which I mentioned in my previous post. Both bring geo-location and visualization to the table. I compiled a doc of projects to highlight some key aspects.
Citizen Science: Bees, Birds and Monarchs
Citizen science is another evidence of cognitive surplus where citizens contribute their time to conservation or investigation projects in biodiversity. For example Worm Watch to monitor topsoil quality. Most projects focus on biodiversity and ecosystem services, but there are other incidents which impact sustainability. These include energy and transportation, food, water, material waste or toxicity. There are still few examples in the list that address these aspects. Common Sense and Oil Spill Crisis Map are two. I also noticed that none of the sites seem to be based on a standard software. I guess they all developed their Web solutions from scratch. Some projects support mobile data acquisition. I installed a few on my smartphone including Project Noah, Project Fishmap, Wildlab Birds and Crabs and IBM’s CreekWatch. Below is the CrabApp example which shows how the citizen is assisted through a simple protocol in counting crab sightings on the beach.
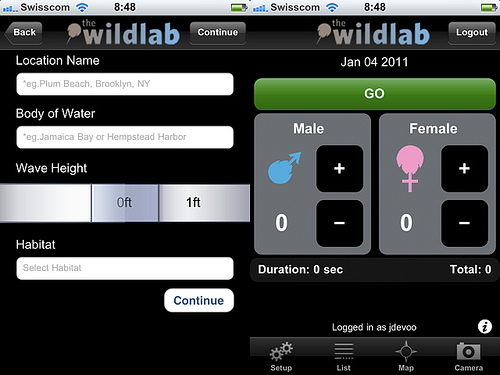
These apps simplify the monitoring protocol (how and what to report) by presenting the citizen with very clear (pictorial) choices of what they see in the field and what’s expected from their sightings. All these citizen science apps make a trade-off between re-use and user experience. They are tailored to the specific needs of their project.
Web and mobile submissions are made by humans. But what about using hardware sensors? Few projects in the list make use of sensing technology and none as Do-It-Yourself project which would be fun in a citizen science context.
All projects in the list are categorized according to a number of criteria:
- Participant intervention in local concerns, using scientific research as a tool to support civic agendas. These are conceived by citizens.
- Support stewardship and natural resource management goals. Regional in scope with explicit educational goals or content.
- Focused on scientific research goals requiring data collection from the physical environment. * ICT-mediated with no physical elements whatsoever, e.g. SETI@home.
- Education and outreach primary goals.
While these criteria are rooted in citizen science, they seem like a good start to categorize a broader range of citizen sensing projects aimed at the participation of individuals in sustainable development projects. Transition movement suggests for example the need for community re-skilling such as knowing how to grow vegetables. There are numerous such skills and their location could be crowdsourced.
Crisis Mapping: Floods and Oil Spills
Participatory crisis mapping represents a fascinating use of ICT. Its a nascent field which distinguishes between map sourcing, analysis and response. These solutions have to be up-and-running in hours and usable by thousands of people anywhere on the planet. They involve a solid dose of process with a pinch of technology. On that point, Ory Okolloh of Ushahidi says:
Don’t get too jazzed up! Ushahidi is only 10% of solution.
Ushahidi is a server software which was conceived to allow people all over the world to tell the story of what was happening to them — or around them — during a disaster or emergency. Despite its roots in disaster relief, it allows anybody to contribute any kind of semi-structured information. One difference between citizen science and crisis mapping online sites lies in the handling of authentication or the need to login before submitting data. Citizen science projects require an account to be created and used to submit data. Crisis mapping relies on a verification process to deal with anonymous data submissions.
Ushahidi is a turnkey solution. It means anyone can take the core application and deploy it to suit a communityʼs needs. Since it is open source, anyone can improve the service in anyway they see fit. This includes the information gathering directives to all participants. Its data gathering protocol is based on a simple form asking for: title, description, category, date, location and news URL. SMS submissions are handled by the administrator who infers information from the text message. The categories can be customized. Below are examples of such categories (apologies for the sloppy image).
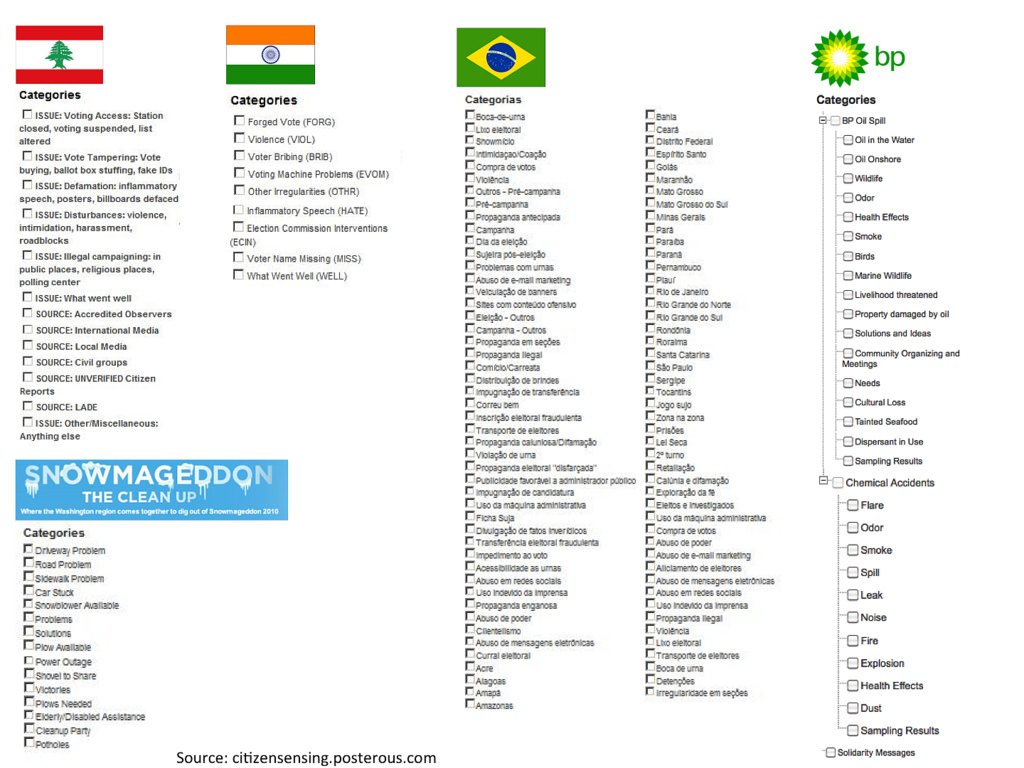
You see categories defined for 3 voting projects (Brazil, India, Egypt) as well as BP Oil Spill and Snowmaggedon. Categories are checkmarks which augment the report submitted by the citizen. There can be multiple checkmarks associated to one report. They refine a report submission and restrict the range of possible values to an exhaustive list. All categories can be disjoint, e.g. a vote irregularity is reported either in town A or in town B. In most cases though, overlaps (multiple choices) are expected by the designer. Groups of checkboxes form value partitions without a covering rule (or consistency check) between the options.
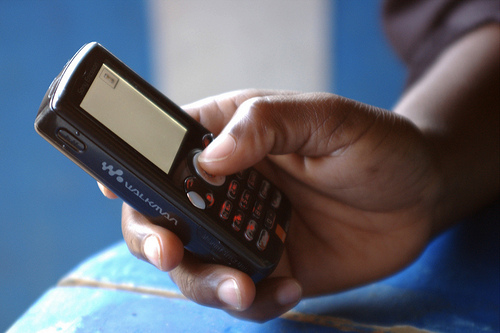
One of the attractive aspects of Ushahidi is the ability to submit reports via mobile. The application supports submissions via plain SMS (for absolute ubiquity) as well as through the use of a native smartphone application (where these devices are available). Below is the iPhone version of the app which interacts with any number of Ushahidi servers. Citizens could be participating to multiple projects simultaneously.
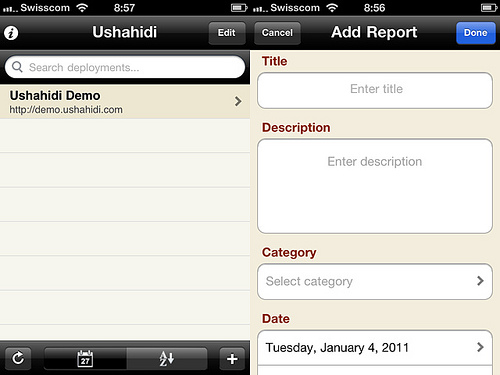
It is adapted to the protocol supported by a default Ushahidi server. If a project required the submission of specific quantities e.g. in numerical format, a convention for extracting these from the open text field would have to be defined and communicated to participants.
The Other 90 Percent
Going back to Ory’s remark, what are additional considerations behind this kind of participatory projects? What can we learn from crisis mapping projects for citizen sensing initiatives? Going back to my short list of projects and to Ushahidi’s best practices, a number of points come to mind. Here are some.
- Is there a common funding pattern for these projects? Or is it always different?
- How clear is the goal of the project? How is it communicated?
- What is the timeline of the project?
- What happens to the data after the project is completed? In some projects on my survey, the data is no longer available.
- What are the benefits of a particular data representation for each partner?
- Who curates data submissions?
- Who will be visiting the site? Who is the audience?
- What are the parameters for data gathering (i.e. the protocol)? The categories scheme above hints at the kind of design that must take place beforehand.
- How viable are the technology choices in the area of concern? Are citizens in the targeted area familiar with the technology?
- What are the security concerns and how are they addressed? Will authentication be required?
- How do you maintain a relationship with participants for feedback/support?
- How easy is it to set up the Web-based solution?
- Why aren’t mobile submissions always possible?
- Have DIY hardware sensors been considered in the protocol? The assembly of such sensors has in itself an education appeal.
- Considered requirements on open data? Projects could allow students trained in R or Excel to download, crunch data under an Open Data License and produce valuable visualizations.
Participatory ICT for Sustainable Development
The mental model for sustainable development has shifted from the Venn Diagram to a pyramid with two new positions: governance and participation. Governance acknowledges the importance of policy-making through complex networks. Participation refers to the co-creation of solutions and joint decision-making. The emphasis on public participation was stressed already in 1998 with the Aarhus Convetion which has been ratified by numerous cities in Europe. Citizen science and crisis mapping solutions involve citizens and enable participation in powerful yet simple ways. Participation can enforce control which is essential to governance. The tools developed for crisis mapping are subject to stringent requirements and provide in my eyes a sound foundation for citizen sensing projects. Citizen science in turn gives us long years of expertise in collaboration between citizens, scientists and NGOs to meet environmental goals. Both fields are showing how citizen participation can work for the benefit of greater resilience of our habitats.
 This material is licensed under CC BY 4.0