David Agus is a cancer specialist that spoke at TEDMED San Diego (CA) in October 2009. In his talk, he advocates a change on how to fight cancer which, in his eyes, is a fight that has not been making any substantial progress in the past decades. He shows that this terrible disease which can be seen as multiple systems operating at multiple scales has not seen its death rate change over the past 50 years. Agus invites us to move away from a reductionist approach and move towards systemic thinking about cancer and in the process getting multiple disciplines working on the problem. An invitation which applies well to the case of sustainability. In that sense, Agus is in line with Peter Senge who made the case for systems thinking in his book The Necessary Revolution in order to facilitate a departure from industrial-era linear thinking towards a more sustainable set of principles.
Here are specific points Agus makes which I found interesting to consider in the context of sustainability:
- Limited vocabulary for describing cancer stems from definitions established 150 years ago and focuses on parts rather than wholes or relationships
- It becomes essentials to understand the inputs and not just through discrete reports (annual visit to the doctor) but as function of time on a continuous basis
- Move away from trying to understand cancer and towards controlling cancer
Vocabulary and Mental Models
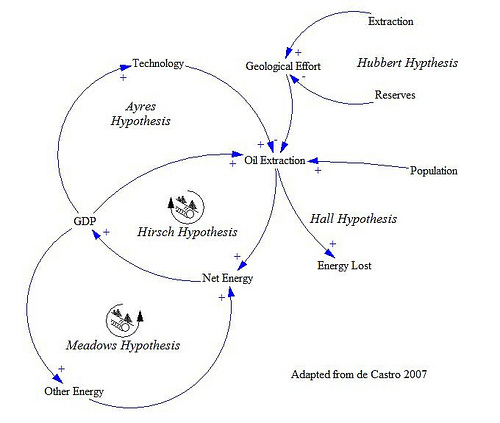
According to Agus, cancer’s vocabulary to describe it has remained limited to symptoms e.g. tired, bloated, pain or body parts e.g. 3cm mass in the liver, breast, prostate. Promising research has already begun change the way we describe cancer in ways more closely related to the mechanisms and flows it impacts rather than individual components of the body it affects. I believe there’s a parallel here with matters in sustainability and the way we describe them. Without going into any particular context of sustainability, I believe there is a lack of common vocabulary focusing on the interdependencies and flow mechanisms at play in a given context or level. We often end up with a scary list of “body parts” describing where it hurts – Lomborg’s infamous litany. Bluefin tuna overfishing, Arctic summer ice (global warming), peak oil (non-renewable energy), polar bears (biodiversity) are pain points which are symptoms of more fundamental mechanisms which we fail to identify as we lack common mental models. What do I mean with that? The model below is a causal loop diagram (CLD) representing common hyptheses at work when discussing peak oil. It was presented by de Castro at the 2008 International ASPO Conference in Barcelona, Spain. It shows a number of interrelated variables with arrows indicating the relation and a sign representing influence in the same or opposite direction.

The hypthoses included in this diagram which I re-created from the ASPO slides using Vensim (hopefully without introducing mistakes) are listed below by author name.
- Hubbert: discoveries of oil fields is limited by stocks of undiscovered resources and oil production is limited by reserves
- Ayres: technological innovation increases at constant rate and favors renewables production
- Hirsch: there is a positive correlation between GDP and oil production
- Meadows: technological innovation and renewables production is bounded by GDP
- Hall: extracting energy requires energy (Energy Returned on Energy Invested)
Studies that relate key concepts in commonly agreed mental models like these are usually more complex and subject to a great deal of discussion by specialists. They are unfortunately still mostly unknown to wider audiences. Expanding our vocabulary beyond isolated pain-points will be essential to form a shared vision of our future and agree on policies unlike what we have seen in Copenhagen for COP15. The transition movement, which sees peak oil as one of the two culprits justifying its raison d’être, seems to have expressed interest in an update to the World3 SD model designed by Dolores García (of ASPO UK) which she extended to included climate change and relationships to energy and resources.
Inputs and Sensing on a Continuous Basis
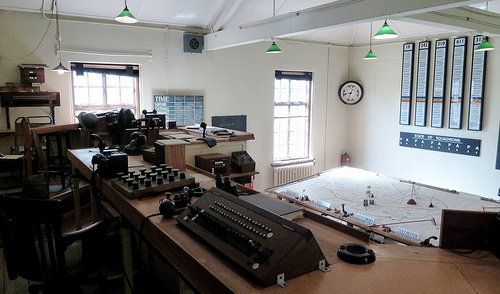
You may have noticed in certain World War II movies scenes taking place in a large room occupied by staff with headsets pushing miniature troops, planes and boats on a table. Usually, a group of more senior officers stand on an elevated platform overlooking the map and position of combat operations.
It’s the operations room.

Photo by vapour trail
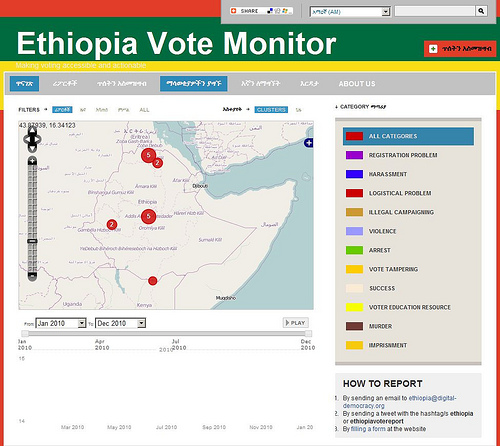
With advances in business intelligence software, lower cost of display technology, many companies implement one or more operation rooms. These information radiators display performance indicators linked to business goals at various levels. They are usually custom-made for the organization, communicate information in simple ways (using both analog and digital visualizations), and adhere to UX design principles. Depending on their purpose – strategic, analytic, operational, etc. – operation room visualizations balance data representation between what’s going on right now and what has been going on. Data can be collected from a wide variety of sources. On January 12, 2010 an earthquake hit Haiti and brought a large number of organizations to collaborate setting up an SMS shortcode to provide information and help quickly to Haitians. In this context, US Southern Command took unprecedented steps to incorporate crowdsourced information from public-private sources at its operations room level. This included data based on Ushahidi. Ushahidi is an open-source disaster-relief application taking reports from people (via SMS, web or e-mail) and producing a map with pins moderated by individuals processing incoming messages. The map is reminiscent of the operations room table with the staff around it asserting the plausibility of incoming data and placing it on the table for operative decision-making. As another example, the picture below shows the use of Ushahidi to monitor votes in Ethiopia.

Source Ethopia Vote Monitor
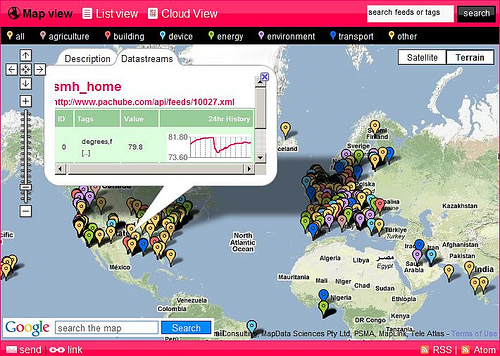
Alongside these Ushahidi-based applications, I want to point out another interesting effort in visualizing indicators as a function of time: Pachube. While Ushahidi is designed around what I would call soft sensing, Pachube targets makers of acquisition hardware willing to format their data in an agreed XML format. In exchange, Pachube displays the data stream on a map in the as a chart providing a sense of what has been going.

Source Pachube
Reporting sustainability indicators on national or global levels where data sources are both public and private take usually longer to assemble and don’t yet follow these crowdsourced collection mechanisms, see e.g. the dashboard on sustainability by the Swiss Federal Office of Statistics. As a result, such dashboards are designed for a strategic rather than operational use. But what if people could access up-to-date progress of indicators providing them with a sense of change in sustainability habits and ultimately their impact towards given sustainability goals?
Generally speaking, aggregating feeds from different parts of an organization is a challenging undertaking left to data specialists, enterprise architects and members of the organization which able to define and instrument pertinent performance indicators best reflecting how far or close they are from the goal.
Control and Management Cybernetics
Don’t try to understand, try to control it says David Agus when speaking about fighting cancer. There is actually a science devoted to studying control: cybernetics. Norbert Wiener, a professor of Mathematics at MIT, officially gave the name to this body of study identifying communication, closed-loop structures and feedback as pervasive to natural and man-made systems. Ross Ashby is another important contributor to this field and father of the Law of Requisite Variety which states that “only variety destroys variety.” Variety is to be understood as the number of states a system can have and the law suggests that the regulator of a system must match the variety of the system it aims to regulate. Other influencers include Warren McCulloch, Claude Shannon, Heinz von Foerster, Gordon Pask and Stafford Beer.
I first read about Stafford Beer through Tom Graves of Tetradian who is an enterprise architect that incorporated parts of Beer’s theories into his own models, in particular his Sevice-Oriented Enterprise. Beer has focused on management cybernetics and devised a model called Viable System Model to which I will come back in future posts. Beer showed the potential of the VSM approach in an amazing project called Cybersyn for Cybernetic Synergy sponsored by Chile’s president Salvador Allende. This took place between 1970 and 1973.

Source Wikipedia
At the time, Chile’s economy is stagnant with 35% inflation. Allende is president since November 4, 1970 and his ambition is to set his country on track for socialism: nationalization of large-scale industries, establishment of public healthcare and educational systems and expansion of agrarian reform – la vía chilena al socialismo. The opposition came from inside with incumbent industrial monopolists and land owners as well as from outside with the US fearing a communist example in Latin America. The government was set to take establish central economic planning following a quick massive nationalization – an enormous challenge. Fernando Flores, lead project manager for central economic planning asked Beer to help and apply cybernetic principles to organize the country’s economy. The premise of VSM is to preserve the viability of the system under study – family, organization, industry segment, nation.
To be considered viable, a system has to be capable of adapting to its constantly changing environment. It has to be capable of preserving its identity and assimilating and making use of its experiences; it has to be capable of learning and of continuing to develop. (Cwarel Isaf)
The VSM model implemented by Beer in Chile which was materialized in the ops room shown above is applied recursively from the country-level down to an individual enterprise, enforces decentralized control, lets decision makers to operate on ranges rather than floods of detailed data (like in Agus’s example of the doctor calling in his patient only when unexplained spikes in the chart occur) and acts as a powerful support tool for decision and policy making. This methodology is applied today by several consulting firms including Syncho headed by Raul Espejo, an advisor on the original project cybersyn project team and Malik Management in St. Gallen (Switzerland) which delivers modern ops rooms to corporations around the world.
Viability and sustainability are two sides of the same coin and I see the benefit of further exploring the potential use of technologies such as Ushahidi and its crowdsourcing approach to operations, Internet of Things for instrumenting sustainability indicators and finally the VSM to provide balance in the amounts of variety generated along the linkages of a blueprint for citizen sensing.
 This material is licensed under CC BY 4.0
