
Gauging Impacts

Photo by Daniel Goodwin
With current figures showing that approximately 40% of carbon emissions are attributable to household and transport practices in the UK, engaging citizens in more sustainable lifestyles is one of the biggest challenges to UK government initiatives on climate change.
Source: Shane Fudge and Michael Peters, Behaviour Change in the UK Climate Debate: An Assessment of Responsibility, Agency and Political Dimensions, Sustainability 2011, 3, 789-808
I have previously written about the Web of Things as an emerging set of technologies useful for instrumenting activities with a direct or indirect impact on resource stocks such as water, air or waste. Real-time indicators established through sensing of our environment are an essential requirement of viable systems such as cities under abruptly shifting natural conditions. While Web of Things contributes a wide range of technologies for hard sensing such as digital thermometers, CO2 or water flow sensors, a number of events cannot be easily instrumented. Soft sensing complements those indicators who are best reported by humans, e.g. a voting irregularity or the presence of waste on along a creek segment.
As a citizen living in the anthropocene I am interested in sensing environmental impacts, but which ones? Is there a model which could be used to identify those indicators which most influence the state of our ecosystems from a citizen’s standpoint? Once identified, which of these can be instrumented applying the distinction between hard and soft sensing?
In this post, I want to outline the use of a model mentioned previously and known as Pressure-State-Response model to address these questions. As not all cities are created equal and our cultural value memes differ from place to place even among occidental cultures, I will have to make assumptions with regards to the indicators suggested. Finally, the approach suggested takes into account the different levels or scales at which sustainability indicators play out – household, neighborhood, and city. While measuring and sensing at the citizen level is the basis, change and adaptation take place at the group level.
The PSR Model
In a previous post, I presented a simple napkin to discuss sustainability questions and set a baseline which shows how we impact the environmental systems we depend upon. Enter the OECD Pressure-State-Response (PSR) model for monitoring environmental degradation. The following diagram represents the PSR model in relation to elements introduced in the napkin model.
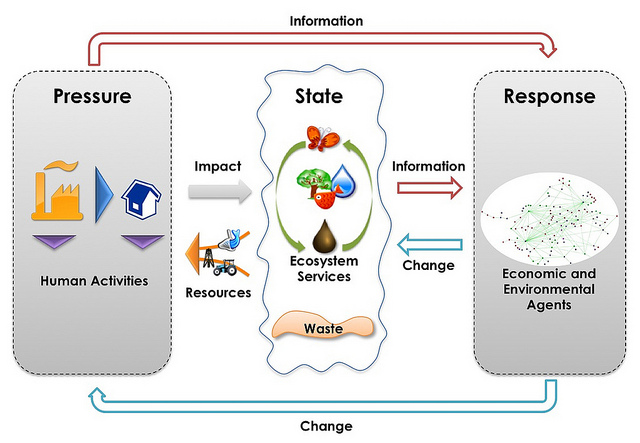
The PSR model was developed in the 70s by Statistics Canada and considered human activities exerting “pressures” on ecosystems and affecting their service’s performance, i.e. quality and the quantity of available resources (“state”). The social systems supporting human activities can then respond then to these changes through environmental, economic and sectorial policies as well as through changes in awareness and behavior (“response”). Let’s take CO2 emissions as an example.
What pressures can be identified for CO2 emissions? Examples of human activities (extraction, production, consumption, trade) exerting pressures are energy, transport, industry, and agriculture. Pressures include the intensity of resource extraction and the rejection of substances produced by society into the biosphere a.k.a. ecosphere (i.e. lithosphere, hydrosphere, and atmosphere). What state is affected by CO2 concentration?
Indicators of environmental conditions relate to the ecosystem services including the quality and quantity of natural resources. They are indicative of the effectiveness of environmental policies and pressure awareness. Examples of indicators of environmental state are:
- concentration of pollutants in environmental media exceeding critical loads
- population exposure to certain levels of pollution or degraded environmental quality and related effects on health
- the status of wildlife and of natural resource stocks
As environmental state can be difficult or very costly to measure, pressure indicators are often measured instead as a substitute. Finally, what responses are identified for CO2 pressures? Response indicators show the extent to which society responds to environmental concerns. Examples of indicators of societal responses are
- environmental expenditure
- environment-related taxes and subsidies
- price structures
- market shares of environmentally friendly goods and services
- pollution abatement rates
- waste recycling rates.
In practice, indicators mostly relate to abatement and control measures. Indicators showing preventive and integrative measures and actions are more difficult to obtain.
There’s a more refined version of PSR called DPSIR which adds “driving forces” and “impacts” to the original model. Both are used today and DPSIR is the basis for the sustainability monitoring systems MONET used by the Swiss Federal Office for the Environment.
Citizen Sensing
Taking my activities as a citizen living in Western Europe and following PSR as a reference model, I attempted to identify the Pressure and State parts of the PSR model. The result is shown in the mindmap below for 2 levels. I looked for the main activity groups in the household and for each, the resulting pressures on the environment. Then, I looked at the environment and looked at a number of state indicators. I left out the response dimension of the model for a future post. Finally the diagram shows 3 sensing sources.
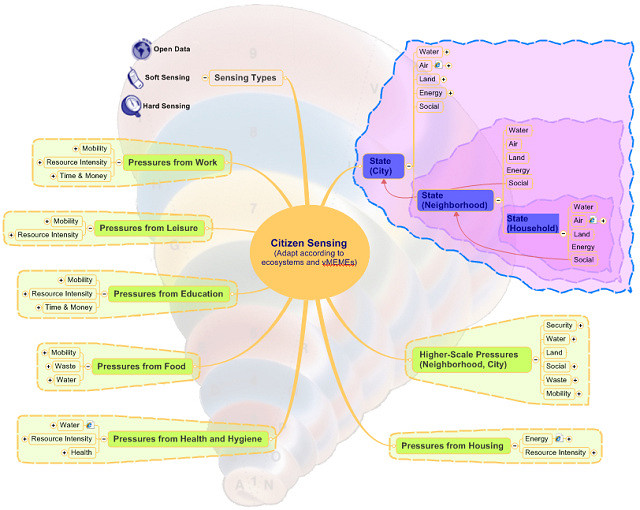
As a citizen, I identified six key activities including work, leisure, education, food, health and hygiene, and housing. To that, I add activities which stem from collective action at the neighborhood or city level, i.e. pressures which stem from group action. Pressures which stem from these citizen-centric activities fall into categories including
- mobility
- resource intensity
- time & money
- water
- waste
- health
- land
- security
- social
- energy
Resource intensity refers to the material aspects covered in Annie Leonard’s Story of Stuff. Mobility pressures include fuel usage for vehicles, distances traveled by airplane, delays from traffic jams, countries of origin for imported goods. Resource intensity and waste include quantities of material purchased (e.g. gear) or discarded, electronic waste, batteries, and paper usage. State information covers essentially water, air, land, energy and social dimensions of our environment. The tracking of biodiversity for examples falls under land and is monitored today by citizen science programs across different ecosystem service types. The social dimension of the state monitoring is used as way to link different levels between household, neighborhood, friends, city or higher.
Pressures and states could be sensed in one of three ways: either automatically (hard sensing) or reported by the citizens themselves (soft sensing). A third option would be used for indicators relating to supra-household domains and made available as open data by the administration. An example of open data is the recently launched site data.gov.sg by the Singapore Government. Sites like these could become more common in the future and be integrated in citizen dashboards for indicators which are best instrumented by the public administration. The relevance of such sites is directly related to their ability to supply data which is not stale.
My Pressures Are Not Your Pressures
The spiral depicted in the background of the mind map is a reference to Don Beck’s theory of human development also known as Spiral Dynamics. It’s my way to say that the indicators identified in this small PSR exercise are highly dependent on life conditions and the environment we live in as citizens. The Spiral Dynamics theory argues that we form mental models which help us cope with those conditions and that we evolve these models in time and as the conditions change. The models are organized around so-called value memes – a set of core values applicable to individuals as well as entire cultures. The table below gives an overview of the models or themes identified by the spiral dynamics model. I added a column (in yellow) to suggest the sensing focus for each theme.
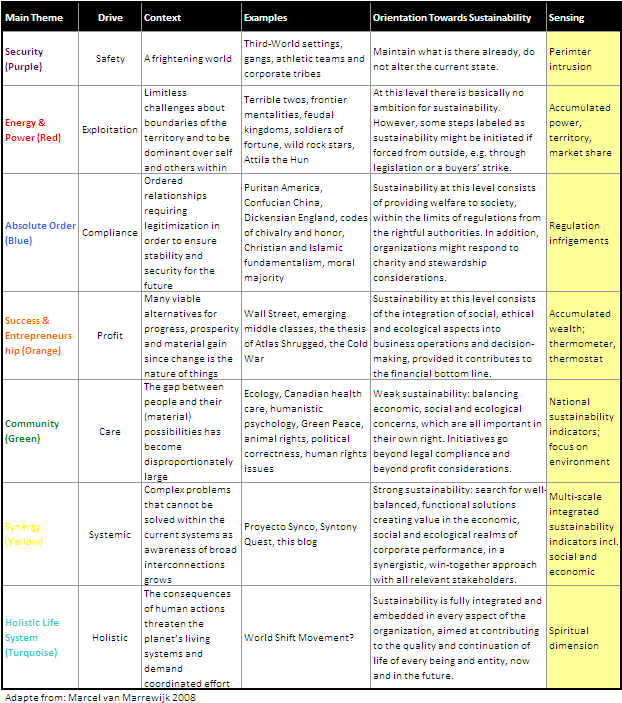
Although I indicated in the table above that I see this blog under the yellow theme on the spiral – it’s really an aspiration. Most of the indicators are still in the environmental plane with few contributions on other planes which are also essential to the viability of a community.
Caveat Emptor
The PSR model does not capture dependencies between indicators explicitly ignoring underlying dynamic processes. In a discussion with @phisab about the general approach of instrumenting our environment, other concerns popped up, not necessarily related to PSR itself. First, there’s a general lack of understanding of the mechanisms required to effect large-scale societal change from programs focusing on the individual as shown in the study cited at the beginning of this post. Second, a great deal of effort will be required in precise, commonly agreed, normed, definitions of what is being measured for tracking pressures and state changes through real-time indicators. Third, there could be doubts around sensing itself with regards to behavior change of a single household – something I mentioned in a previous post on peer pressure.
Departure From Causality
Cities are complex systems and when things go wrong, our reductionist brains are wired to seek out the single cause behind the social, economic or environmental crisis instead of paying attention to the relationships between the subsystems involved. The purpose of sustainability dashboard powered by citizen sensing is to detect disturbances in a system rather than tracking individual parameters of its subsystems. An analogy would be the barometer gauge indicating atmospheric pressure. To read the dial, you’d tap the glass looking for the needle’s shift in one direction or another rather than reading its position value. A way to further refine the disturbance gauges would be to represent actuality, capability and potentiality for each measure: actuality refers to what’s normally achieved, capability refers to what’s been planned and potentiality refers to what could have been achieved. Lastly, I want to say that some indicators are best represented by a pin on a map rather than a trend line as a function of time.
The linking of multiple levels of action within the dashboard would be another essential feature in order to take group dynamic into consideration including friends (strong-tie networks) but also neighborhoods (weak-tie networks) living in the city. The underlying sensing infrastructure serves as coordination channel between the various levels involved. Bottom-up environmental sensing by citizens can be very effective to the public administration as seen recently in Japan. The adhoc network of Geiger sensors assembled right after the disaster in Fukushima is an example of how citizen participation brought increased resilience to the system as the official sensing network did not kick in after the disaster struck.
In summary, viability dashboards powered by citizen sensing would be the equivalent of a coordination platform fueled by civic engagement. The indicators would be defined by the citizens themselves according to pressures and states of their environment while considering their value memes. The representation would focus on variations, support mapping and critically link various levels of intervention from the citizen up to the city as a whole.
 This material is licensed under CC BY 4.0